After 667 DOM Oceanfront Home at 425 Paseo De La Playa Sells


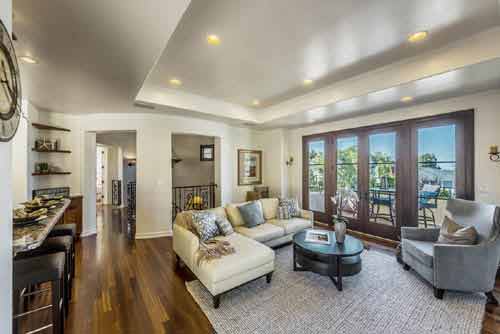
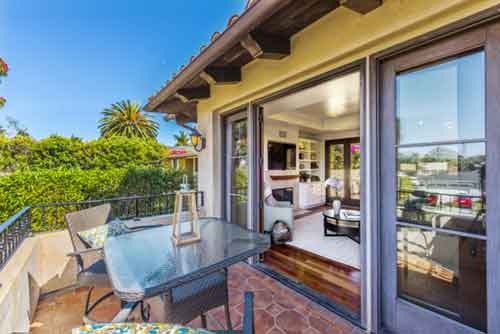
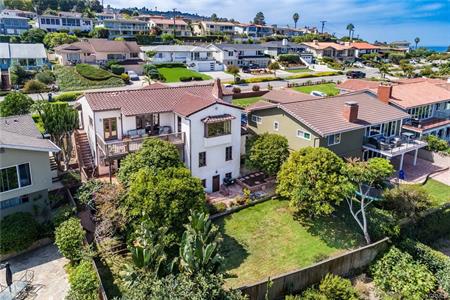
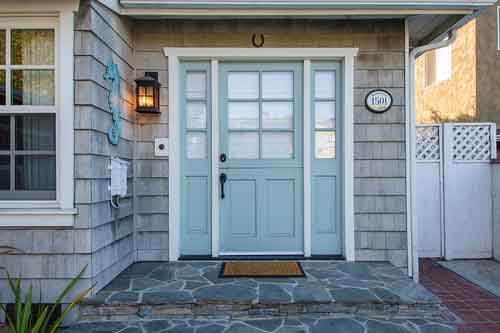
The highest priced home sale of the month was a single family at 602 Calle De Arboles that was listed for $2,695,000 and closed at $2,650,000. The home was built in 1997 and offered 5 bedrooms, 4 baths and approximately 3,285 square feet on a 6,000 foot lot. The home didn’t last long and went into escrow after 10 days on the market.
Search the current Hollywood Riviera homes for sale
Listing courtesy of Igor Nastaskin – RE/MAX Estate Properties 310-378-9494